• Hi!
    I'm Lakhan

    Data scientist

    "A passion for solving real-world problems through data analytics"

    Download CV

  • I am
    a Data Scientist

    Welcome to my portfolio

    View Portfolio

About Me

Who Am I?

Hi I'm lakhan jadamWelCome to My Portfolio !, a passionate Data Analyst with a keen interest in transforming raw data into actionable insights. My journey in the world of data analysis has equipped me with a diverse skill set and hands-on experience with various tools and technologies. This profile showcases my work and projects in the realm of data analysis and visualization.

About Me As a dedicated Data Analyst, I thrive on discovering patterns and trends within data to help businesses make informed decisions. My expertise spans across several key areas: Data Analysis: Proficient in data cleaning, processing, and statistical analysis using Python, R, and SQL. Data Visualization: Skilled in creating compelling visualizations and dashboards with tools like Tableau, Power BI, and Matplotlib. Statistical Techniques: Experienced with various statistical techniques and models to extract meaningful insights and predict future trends. Data Management: Competent in database management, including designing and querying relational databases with SQL.

Data Analysis

Web Scraping

Machine Learning

I am happy to know you
that around 10 projects done sucessfully!

What I do?

Here are some of my expertise

Web Scrapping

extract data from websites for in-depth market analysis, using libraries like Beautiful Soup

Python

Leveraged Python for data analysis, automating data cleaning and visualization tasks.

Machine Learning

Developed predictive models using machine learning algorithms to enhance decision-making.

PowerBi

Designed dynamic Power BI reports to present insights from data

SQL

Utilized SQL for efficient data manipulation from complex databases.

Excel

Excel for detailed data analysis, utilizing formulas and pivot tables for insights.

Cups of coffee
Projects
Queries
Website scraping
My Specialty

My Skills

I have a good proficiency in Python, which I use for data analysis, automation, and building data-driven applications. My skills in Power BI allow me to create insightful dashboards and visualizations that effectively communicate complex data trends. I am also adept in SQL, utilizing it to manage and query databases efficiently, ensuring data integrity and accuracy. Additionally, my expertise in Excel enables me to perform advanced data manipulation and analysis, utilizing functions, pivot tables, and macros.

Python

75%

PowerBi

80%

SQL

85%

Excel

90%
Education

Education

Currently pursuing a Data Scientist certification at prefleaf by Masai (January 2024 – Present), where I am developing skills in Python, Power BI, SQL, and Excel. This program emphasizes practical applications of data analysis and visualization, preparing me for a successful career in data science.

Completed a Bachelor of Pharmacy at Shri Aurobindo Institute of Pharmacy from 2014 to 2019. The program provided a comprehensive foundation in pharmaceutical sciences, including drug formulation, pharmacology, and clinical pharmacy. Developed practical skills through hands-on laboratory experience and internships, emphasizing patient care and medication management

Completed higher secondary education in science with first grade from International Public School in 2014. This program provided a solid foundation in core scientific subjects, fostering critical thinking and analytical skills. Engaged in various extracurricular activities, enhancing teamwork and leadership abilities.

Projects

My Projects

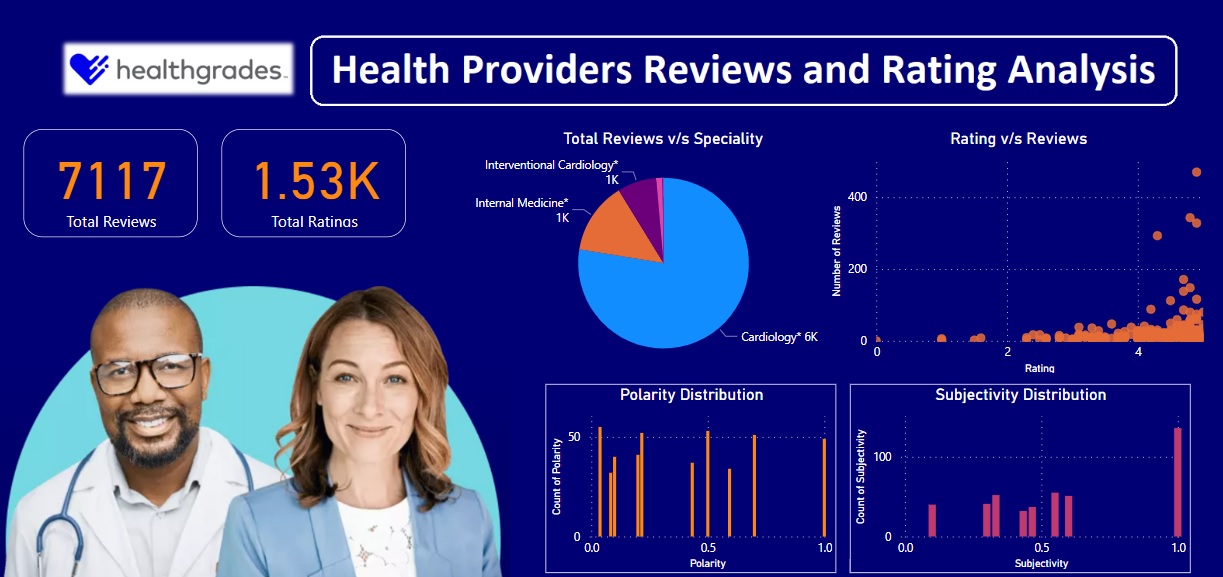
Healthgrade Webscraping and Analysis Python

This project involves scraping data from Healthgrades.com to collect information on doctors, their specialties, ratings, reviews, office locations, and affiliated hospitals. Using Python libraries like BeautifulSoup and Selenium, the data is extracted, cleaned, and prepared for analysis. Key steps include performing exploratory data analysis (EDA) to identify trends in doctor ratings and specializations, and using natural language processing (NLP) for sentiment analysis of patient reviews. The project concludes by visualizing insights through dashboards, offering valuable information for healthcare providers and patients seeking healthcare services.

MNIST digit classification Machine Learning

This project focuses on using machine learning to classify handwritten digits from the MNIST dataset, which contains 70,000 grayscale images of digits (0-9). The process involves normalizing and reshaping the images for efficient training, followed by the application of algorithms like Logistic Regression, Support Vector Machines (SVM), or Neural Networks. The models are trained and evaluated using metrics such as accuracy, precision, and confusion matrix. Performance is further enhanced through hyperparameter tuning and regularization. This project showcases the core principles of supervised learning and image classification.

Customer Behaviour Analysis Excel,PowerBi

This project focuses on analyzing customer behavior using Excel and Power BI to uncover trends and insights. Data is first organized and cleaned in Excel, where basic statistical analysis and pivot tables are used to summarize customer demographics, purchasing patterns, and preferences. The cleaned data is then imported into Power BI for deeper analysis and visualization. In Power BI, interactive dashboards are created to track key metrics like purchase frequency, average order value, and customer segmentation. These visualizations help identify patterns in customer behavior, providing actionable insights for improving marketing strategies and enhancing customer engagement.

Customer Churn Analysis Excel

Customer churn analysis in Excel involves using data like transaction history and service usage to identify patterns of customer loss. With tools such as pivot tables, charts, and formulas, businesses can visualize trends and pinpoint factors driving churn. Excel enables efficient segmentation and analysis, helping companies improve retention strategies and reduce churn rates.

Car24 Sales and Market Trend Analysis SQL,PowerBi

The Car24 Sales and Market Trend Analysis project involves utilizing SQL for data extraction and Power BI for data visualization to assess sales performance and market trends. In SQL, relevant sales data, such as vehicle models, customer demographics, sales volumes, and regional performance, are queried from a database. This data is then cleaned and transformed to ensure accuracy. Power BI is used to create dynamic dashboards and visualizations, such as sales trend graphs, market segmentation, and geographical performance heatmaps. The analysis helps identify top-performing car models, seasonal sales patterns, and customer preferences, allowing Car24 to make data-driven decisions and optimize sales strategies.

Read

dashboards and Reports

HTML5 Bootstrap Template by colorlib.com
September 14, 2024 | Web Scraping | 4

Health Providers Reviews and Rating Analysis

Health providers' reviews and rating analysis using web scraping in Python involves extracting user feedback from online platforms to assess patient satisfaction and service quality. Using libraries like BeautifulSoup and Selenium, you can scrape data such as provider names, ratings, comments, and service types from health-related websites.

HTML5 Bootstrap Template by colorlib.com
august 1, 2024 | PowerBi | 4

Customer Behaviour Analysis

Customer behavior analysis using Power BI involves collecting and analyzing customer data, such as purchase history, demographics, and engagement metrics, from internal sources like CRM systems or sales databases. This data is then imported into Power BI, where it is cleaned and transformed to create interactive dashboards and reports.

HTML5 Bootstrap Template by colorlib.com
july 14, 2024 | excel | 4

Customer churn analysis

Customer churn analysis using Excel involves analyzing customer data to identify patterns that indicate why customers are leaving. By using Excel functions such as pivot tables, filters, and charts, businesses can segment customers by factors like purchase history, usage behavior, and demographics.

Get in Touch

Contact

150 Shree Kanha Vihar, Indore MP 453555